The app reports a set of fundamental ratios for every listed company, drawn from published financial statements. This page explains what each one measures and how it is calculated.
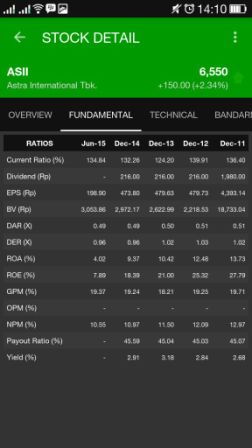
Ratios are a starting point for research, not a verdict. A figure only becomes meaningful when compared against the company’s own history and against peers in the same sector.
Current Ratio (%)
A liquidity measure: how well a company’s short-term assets cover its short-term obligations.
Current Ratio = Current Assets / Current LiabilitiesA value above 1 means current assets exceed current liabilities. What counts as healthy varies by industry — capital-intensive businesses often run lower than retailers. Also called the working capital ratio.
Dividend (Rp)
The cash amount per share distributed to shareholders out of company earnings, as decided by the board and approved in the general meeting.
Mature companies with steady cash flow tend to pay regular dividends. Younger, fast-growing companies often pay none at all, reinvesting earnings into expansion instead — the absence of a dividend is not by itself a negative signal.
EPS (Rp)
Earnings Per Share — the portion of profit attributable to each outstanding common share, and the most direct per-share measure of profitability.
EPS = (Net Income - Preferred Dividends) / Average Outstanding SharesBV (Rp)
Book Value — the company’s net asset value per the balance sheet: total assets minus intangible assets and total liabilities. It reflects accounting values rather than market values, so it can differ substantially from what the assets would fetch if sold.
DAR (X)
Debt to Asset Ratio — the share of the company’s assets financed by debt.
DAR = Total Debt / Total AssetsA higher figure means greater leverage, which amplifies both returns and risk.
DER (X)
Debt to Equity Ratio — how much debt the company uses relative to shareholders’ equity.
DER = Total Liabilities / Shareholders' EquityRead alongside the sector norm: banks and financing companies naturally carry far higher ratios than manufacturers.
ROA (%)
Return on Assets — how efficiently management converts the asset base into profit.
ROA = Net Income / Total AssetsROE (%)
Return on Equity — how much profit the company generates on the money shareholders have invested. A higher percentage generally indicates more efficient use of the equity base, though it can also be inflated by heavy leverage — so read it together with DER.
ROE = Net Income / Average Shareholders' EquityGPM (%)
Gross Profit Margin — the proportion of revenue left after deducting the direct cost of producing goods or services. It shows pricing power and production efficiency before overheads are considered.
GPM = Gross Profit / RevenueOPM (%)
Operating Profit Margin — the proportion of revenue remaining after both direct production costs and operating expenses such as wages, overheads, and depreciation.
OPM = Operating Income / Net SalesBecause it strips out financing and tax effects, OPM is useful for comparing the underlying operating performance of companies with different capital structures.
NPM (%)
Net Profit Margin — the proportion of revenue that survives all the way to net profit, after production costs, operating expenses, interest, and tax.
NPM = Net Profit / RevenuePayout Ratio (%)
The share of earnings paid out to shareholders as dividends.
Payout Ratio = Dividend per Share / Earnings per ShareA ratio above 100% means the company is paying out more than it earned in the period, which is generally not sustainable without drawing down reserves or borrowing. A lower ratio leaves more earnings retained for reinvestment.
Yield (%)
Dividend Yield — the annual dividend expressed as a percentage of the current share price. It tells you the income return on the price you pay today.
Dividend Yield = Annual Dividend per Share / Price per ShareNote that yield rises as price falls, so an unusually high yield can reflect a falling share price rather than a generous dividend. Yields for the current year are often estimated from the previous year’s dividend, or by annualising the most recent payment.
Ratios marked annualized in the app project the latest reporting period out to a full year, so interim results can be compared against full-year figures on a like-for-like basis. Ratios without that label come straight from the most recent published financial report.