DataSahamBot is the Telegram bot of the Data Saham Indonesia app. Once it is linked to your account, it does two things:
- it sends your Price Alerts and Formula-Based Alerts to Telegram, as they happen;
- it draws a chart of any IDX stock on request — with the indicators you choose, and with your own screener formulas plotted on it as lines, histograms and buy/sell arrows.
This article covers linking the bot, requesting charts, and everything a chart can show.
Linking DataSahamBot to the app
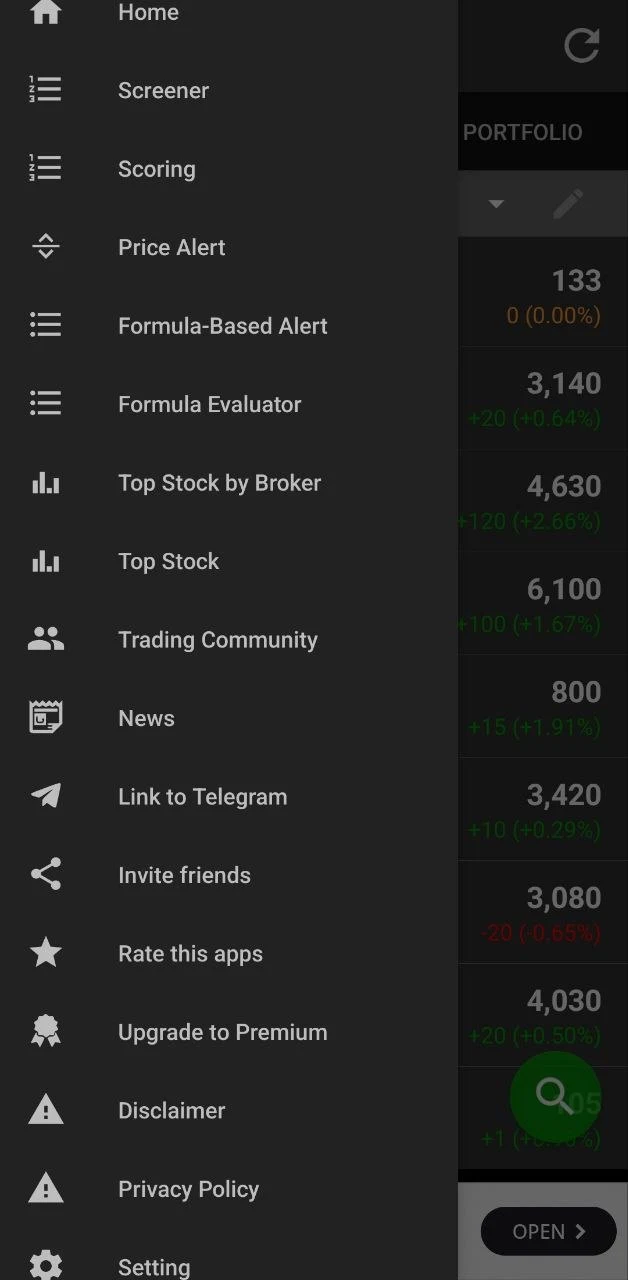
1. In the app, open the menu and choose Link to Telegram.
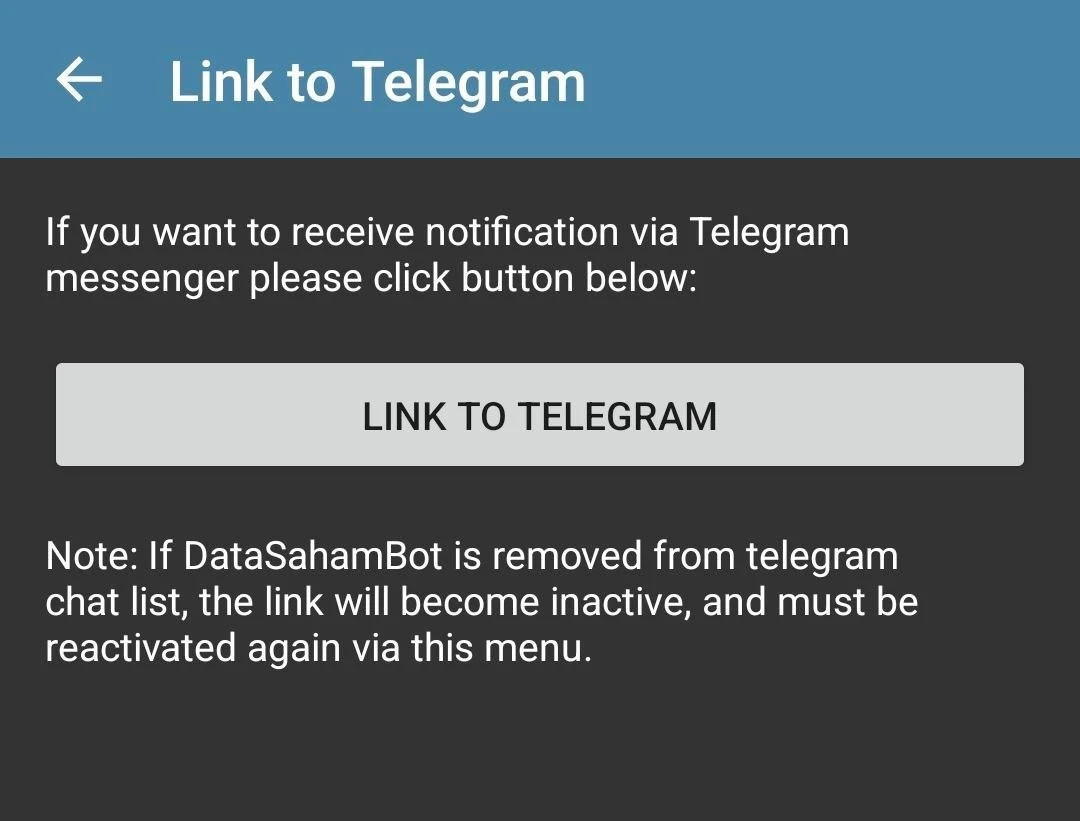
2. Tap LINK TO TELEGRAM. Telegram opens a chat with DataSahamBot.
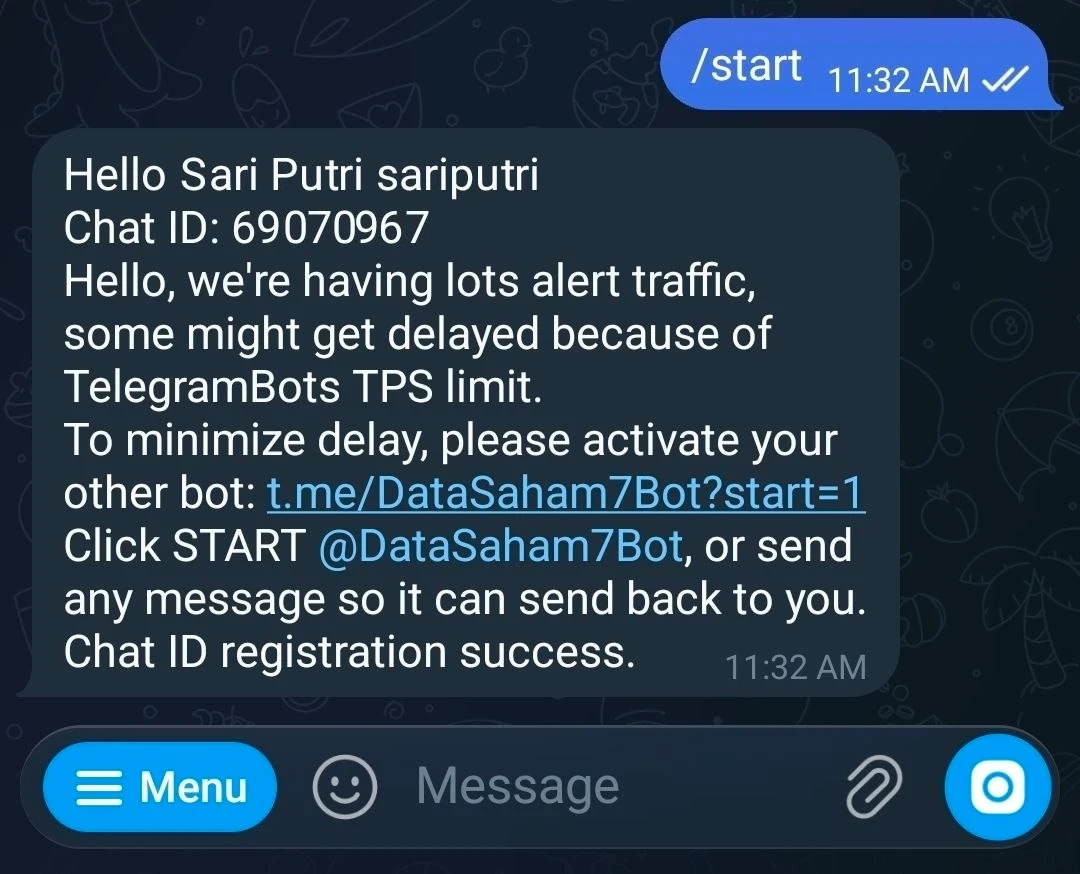
3. Send /start to DataSahamBot. It replies with your chat ID, registers it, and gives you a link to your personal bot — one of DataSaham0Bot to DataSaham9Bot, depending on your chat ID.
4. Open that link and tap START in your personal bot, or send it any message.
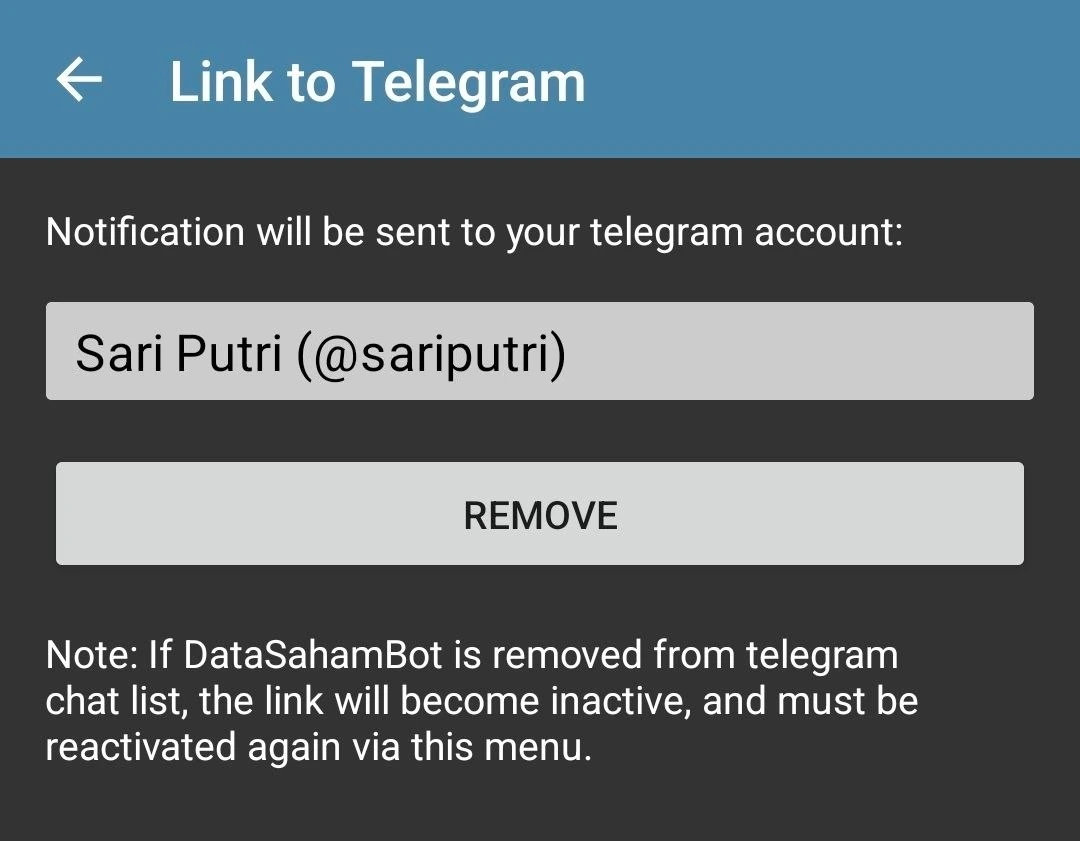
5. Back in the app, the Link to Telegram screen now shows your Telegram name. The link is complete.
From now on your alerts arrive in Telegram:
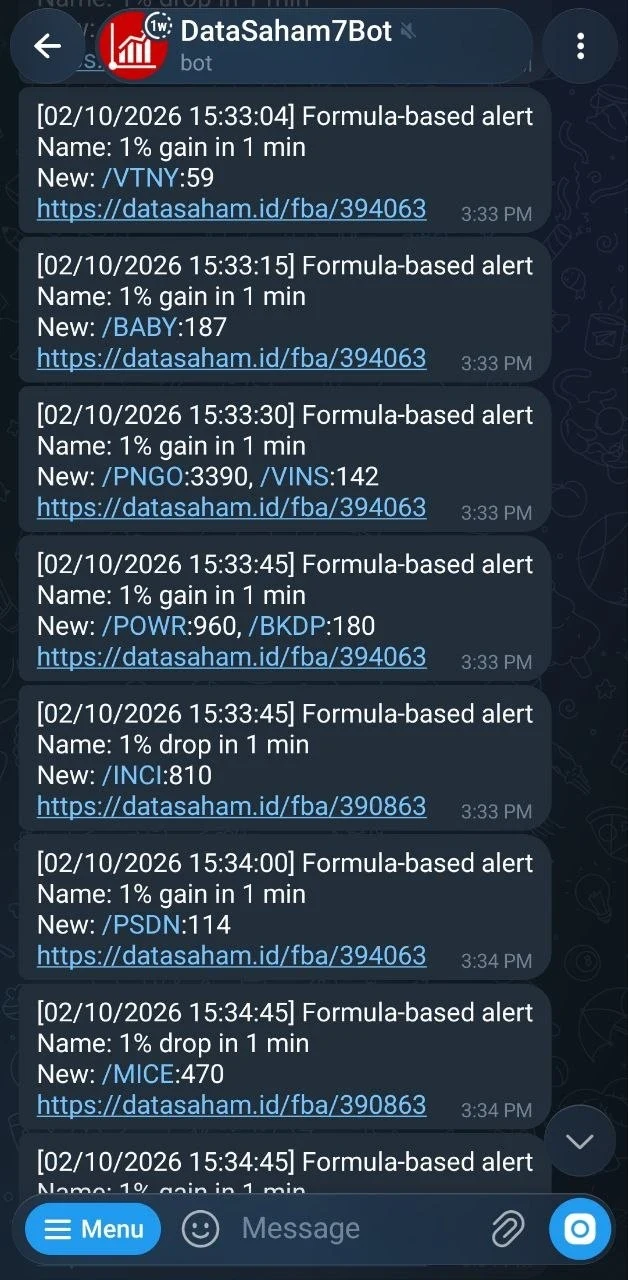
Why a personal bot? Telegram limits how many messages a single bot may send each second. To keep alerts on time, they are spread across ten bots, and each user is served by one of them. A Telegram bot can only message someone who has started it, so until you start your personal bot, DataSahamBot can pass on only the first alert of each day, together with a reminder.
If DataSahamBot is removed from your Telegram chat list, the link becomes inactive. Link it again from the same menu.
Alerts and charts are for your own account. Forwarding or re-posting them to other people, groups or channels — by hand or automatically — is not allowed under the Terms of Use, and can get your Telegram alerts or your account switched off.
Who can request charts
Charts are available in DataSahamBot and in your personal bot alike, to accounts that are linked and have opened the app within the last three days.
- Premium accounts can request as many charts as they like, within fair use.
- Free accounts can request a few charts each day.
- The chart settings (
/indicator,/theme,/bars) are free for every linked account.
To keep the service responsive for everyone, each user can request one chart every five seconds — every 15 seconds after 20 charts in 5 minutes — and at most 100 charts an hour and 500 a day. The zoom and refresh buttons count as charts. Requesting charts with scripts or macros is not allowed; see the Terms of Use.
Requesting a chart
/chart <code> [timeframe] [bars] [indicators]
/<code> [timeframe] [bars] [indicators]
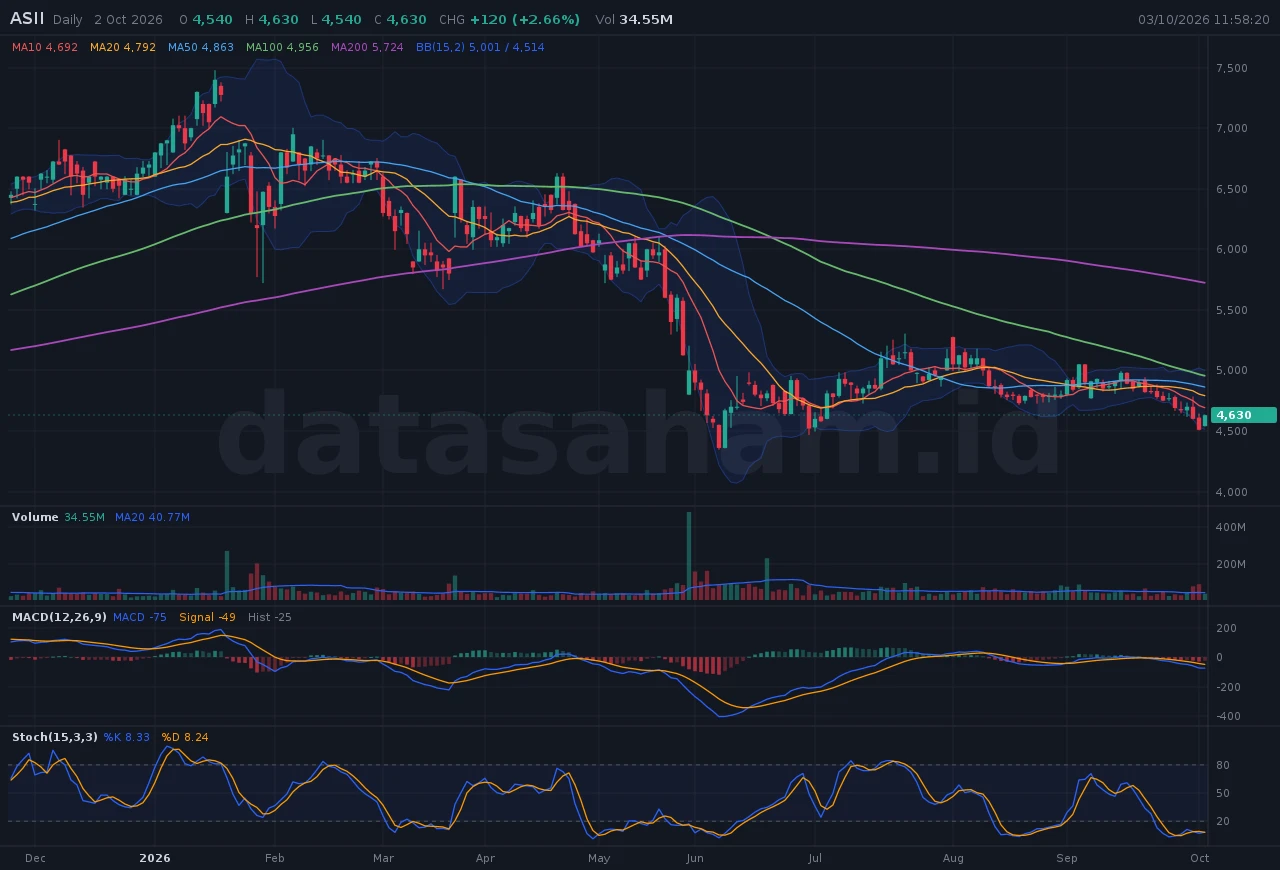
The shortest request is the stock code itself. /bbca draws the daily chart of BBCA, 200 bars, with the default indicators: five moving averages, Bollinger Bands, MACD and Stochastic.
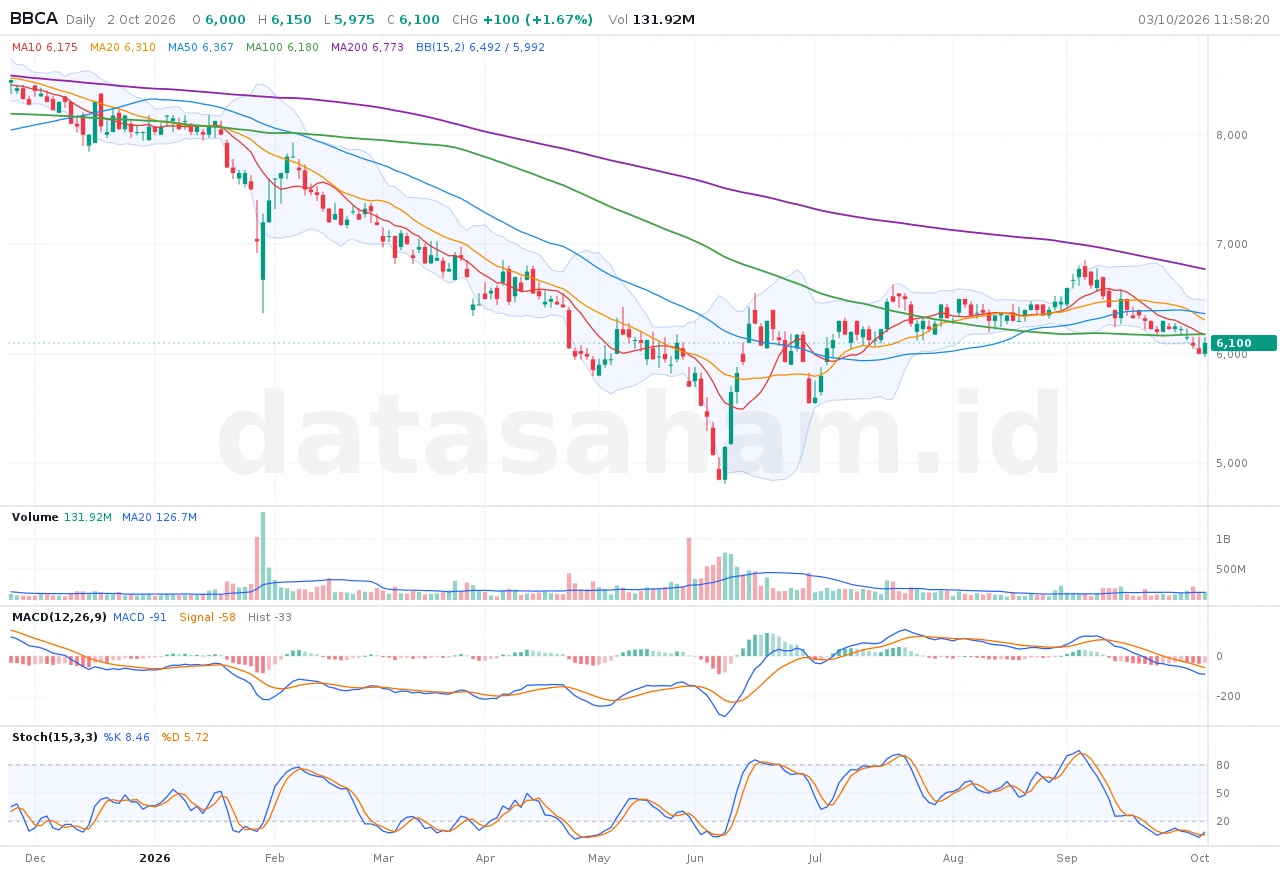
The header shows the last bar’s open, high, low, close, change and volume. Each indicator’s legend shows its latest value.
Timeframes
| Timeframe | Short |
|---|---|
| yearly | y |
| quarterly | q |
| monthly | m |
| weekly | w |
| daily (default) | d |
| 4hour, 3hour, 2hour | 4h, 3h, 2h |
| hourly | h |
| 45min, 30min, 15min, 10min | 45, 30, 15, 10 |
| 5min, 3min, 2min, 1min | 5, 3, 2, 1 |
/tlkm 30              ==> TLKM, 30-minute chart
/chart tlkm 30min     ==> the same
/bbca w               ==> BBCA, weekly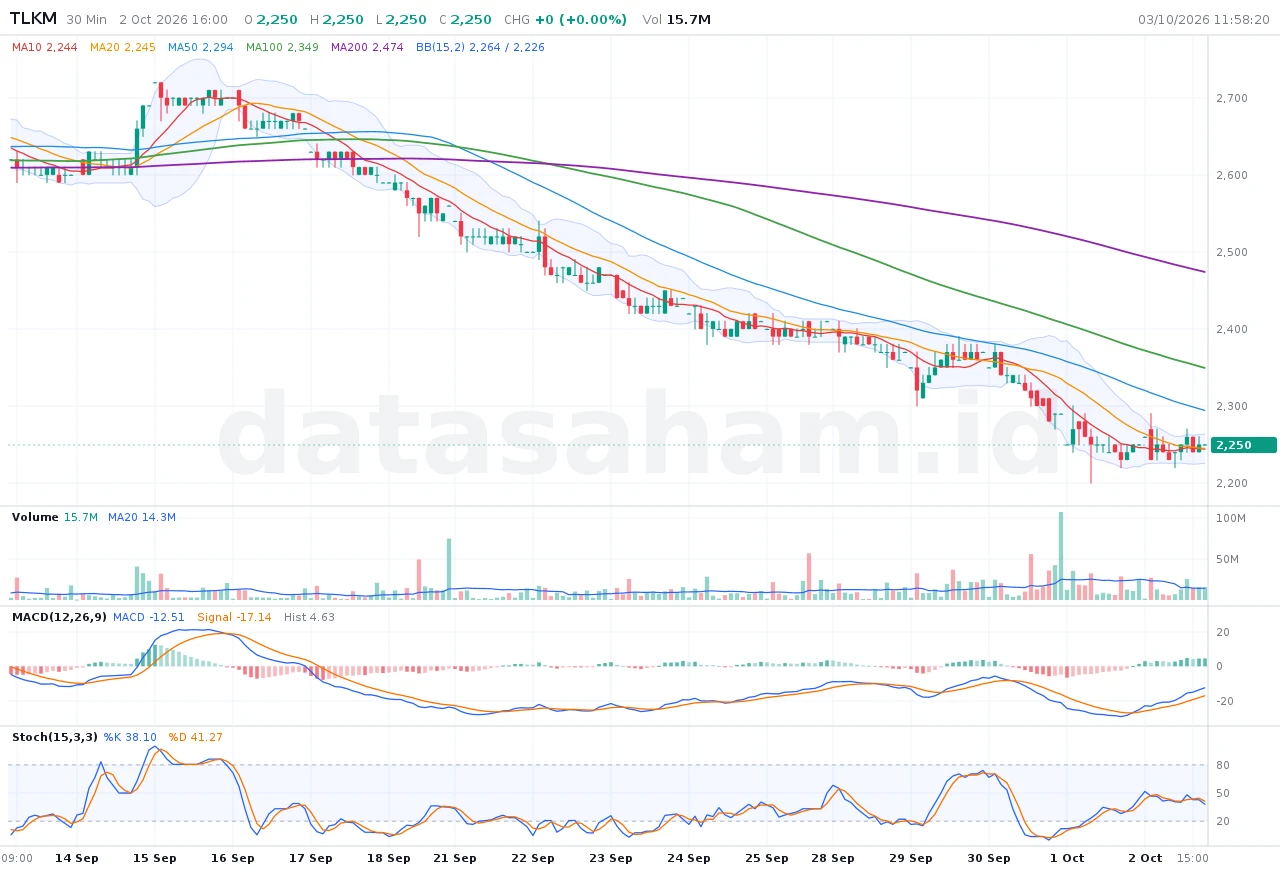
Intraday bars are counted from the 09:00 session open, as on TradingView.
How many bars: zoom
A chart shows 200 bars unless you ask for another number, from 20 to 560. The number goes after the timeframe:
/chart bbca d 60      ==> the last 60 daily bars
/bbca 120             ==> 120 daily bars
A number right after the code that is also a timeframe — 1, 2, 3, 5, 10, 15, 30, 45 — is read as the timeframe: /bbca 30 is the 30-minute chart.
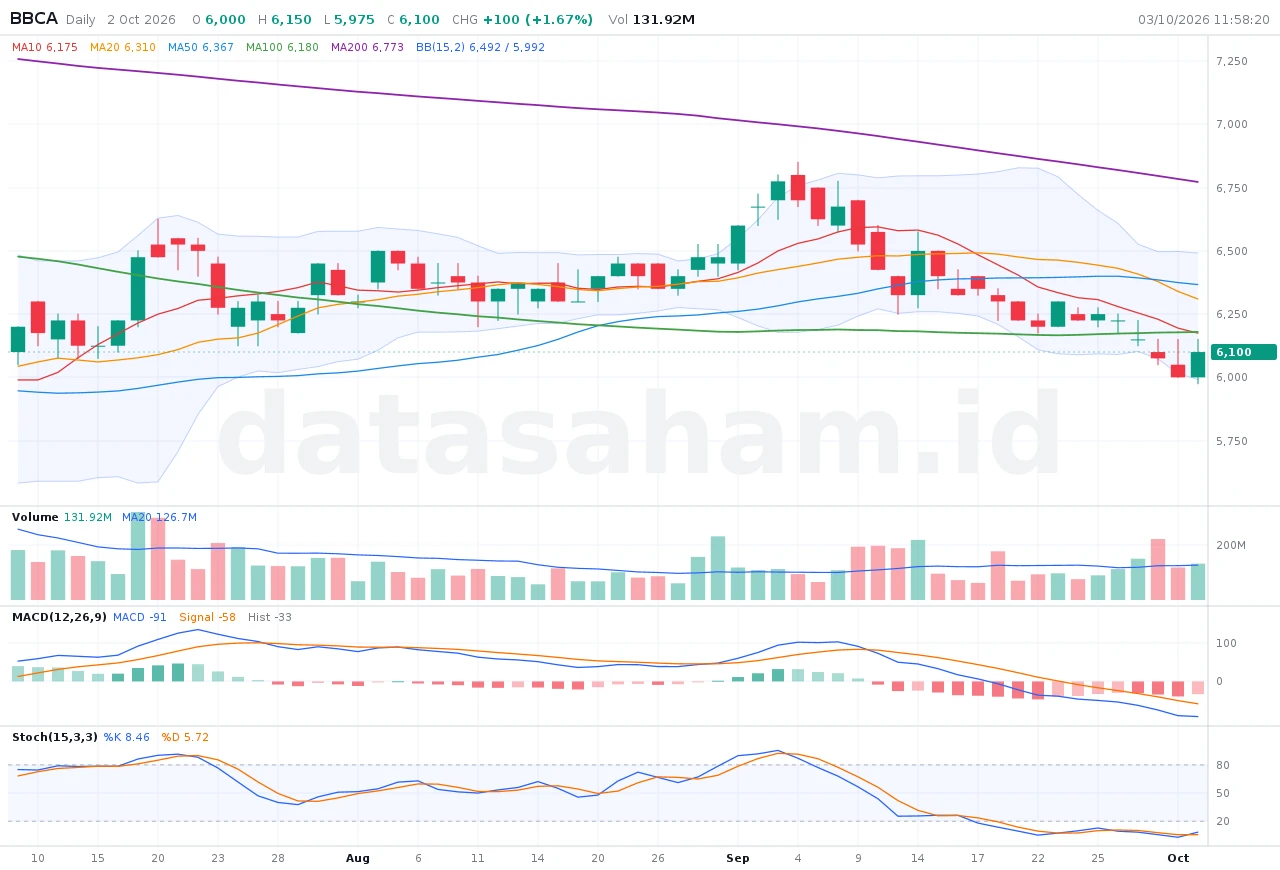
Under every chart are zoom buttons: tap them to redraw the same chart with fewer bars (zoom in) or more (zoom out), without typing the request again.
Indicators
Indicators written after the request are drawn on that chart only:
/chart bbri d macd(12,26,9), rsi(14)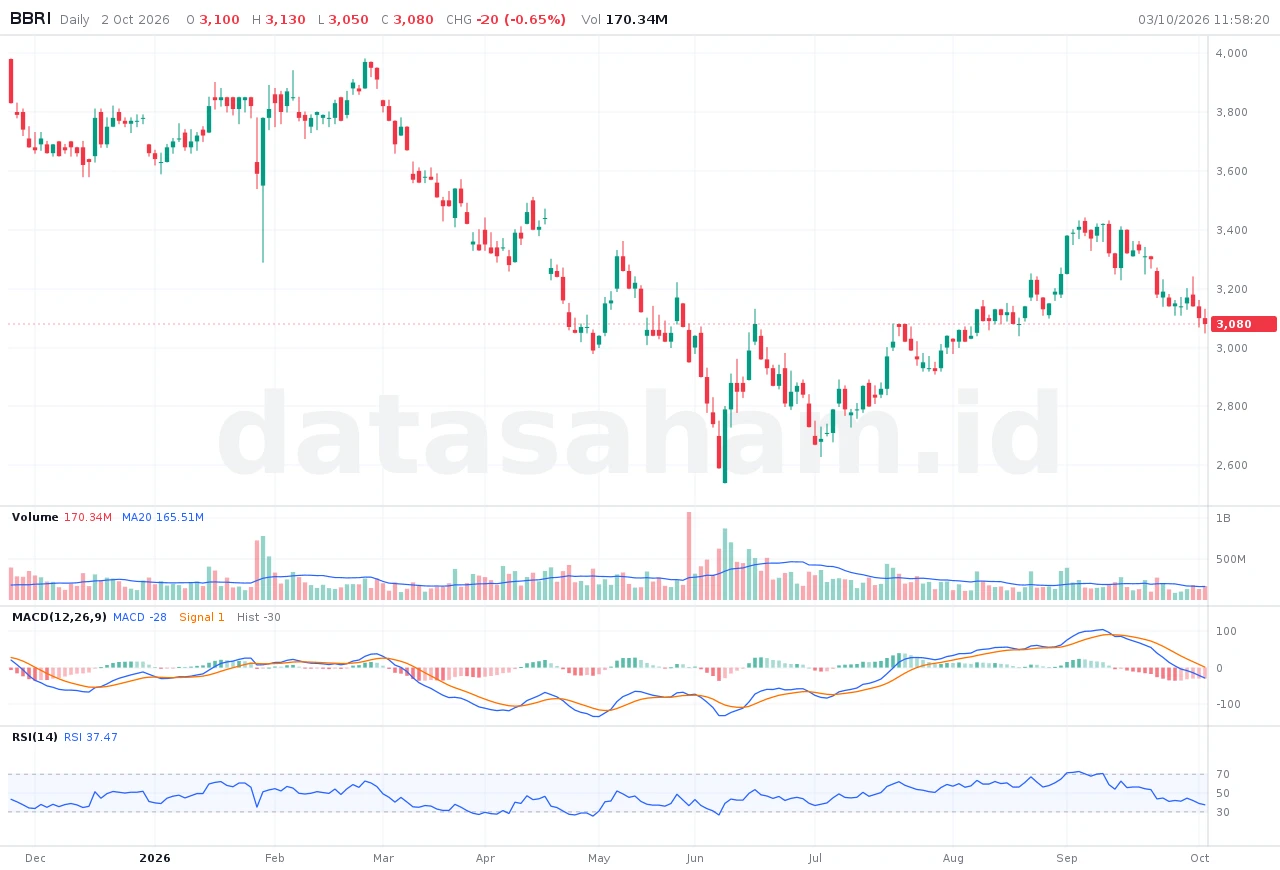
| Over the price | Panels below the chart |
|---|---|
sma(n), ema(n), wma(n), vwap(n) | macd(fast,slow,signal), rsi(n), stoch(n,k,d) |
bb(n,k) — Bollinger Bands | dto(rsi,stoch,k,d) — DT Oscillator |
keltner(n,k), donchian(n) | trix(n), cci(n), atr(n), adx(n) |
psar(step,max) | mfi(n), willr(n), roc(n), obv |
supertrend(n,mult), chandelier(n,mult), darvas(n) | |
foreign, accum, bidoff — foreign flow, broker accumulation, bid-offer |
Separate indicators with commas or spaces. A chart can have up to 6 items over the price and 4 indicator panels, besides the volume panel that every chart has. Leave out the parameters to use the standard ones: rsi is rsi(14), dto is dto(14,8,5,3).
The DT Oscillator draws %K and %D in one panel, on a fixed 0–100 scale with guide lines at 20 and 80. It takes the same four parameters as the dto_stochk and dto_stochd screener functions:
/bbca w dto(14,14,3,3)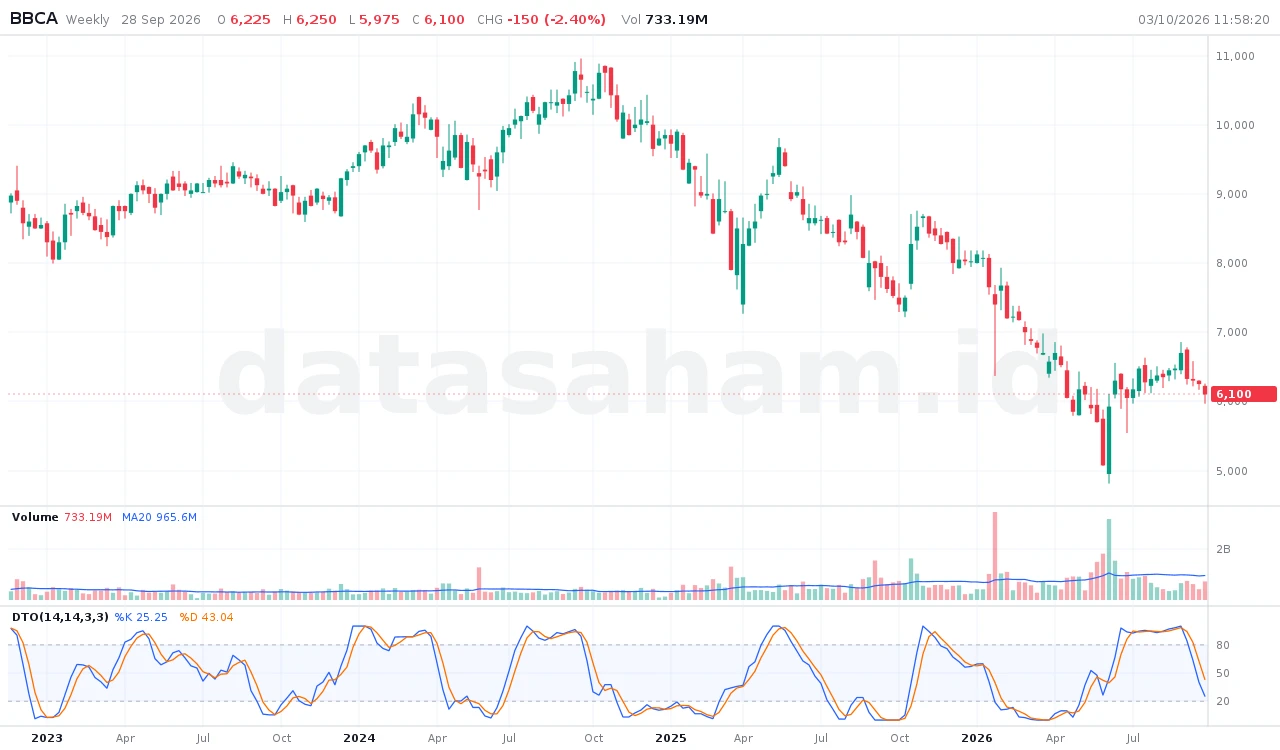
Darvas box, Supertrend and Chandelier Exit
Three trend tools draw the way TradingView draws them, with one word each:
/bike darvas             ==> Darvas box, boxp 5: darvas(5)
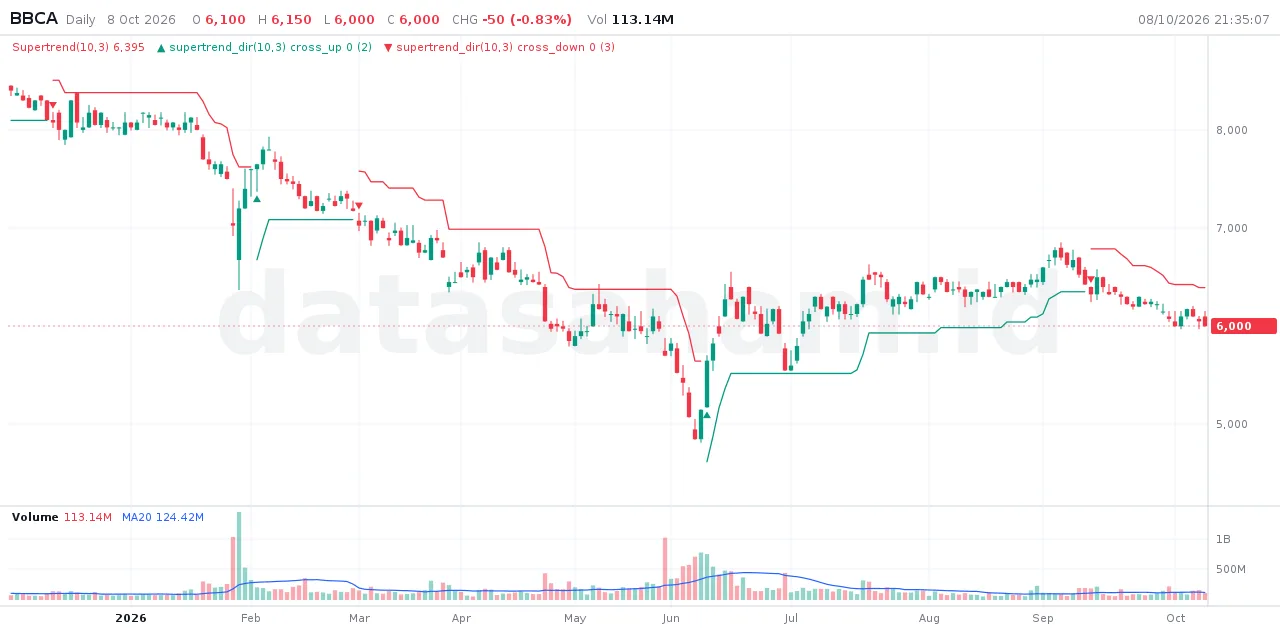
/bbca supertrend         ==> Supertrend(10, 3)
/bbca chandelier ==> Chandelier Exit(22, 3), on closesdarvas(n)draws the box’s top in green and its bottom in red, shaded between, until the next box forms. A box formsn - 2bars after a new high, when none of those bars went higher. Days a stock was suspended have no bar, as on TradingView, so a suspension right after a new high does not count as a pause.supertrend(n,mult)draws only the line in force: green under the price in an uptrend, red above it in a downtrend.chandelier(n,mult)draws the stop in force: the long stop in green in an uptrend, the short stop in red in a downtrend.
The legend shows the current values. To mark where the trend turns, add a signal() with the screener function of the same name:
/bbca d 200 supertrend(10,3) signal(supertrend_dir(10,3) cross_up 0, up; supertrend_dir(10,3) cross_down 0, down)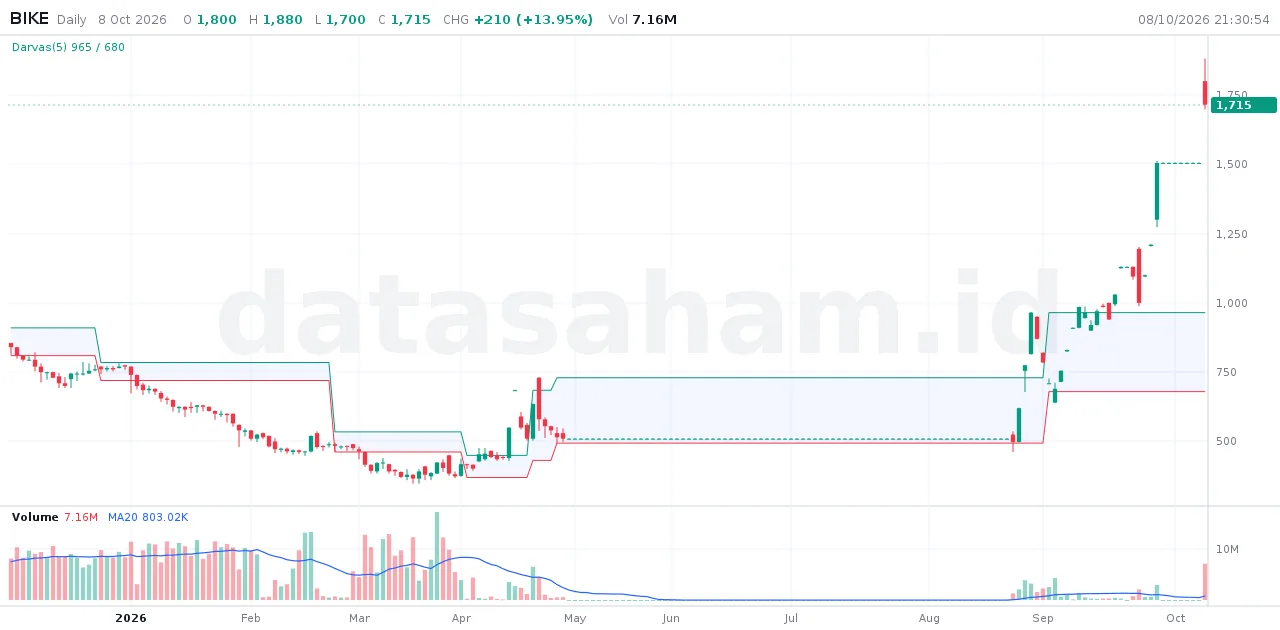
The same values are available to the screener and alerts as supertrend(), supertrend_dir(), chandelier_long(), chandelier_short() and chandelier_dir(); the Darvas box as a formula is in the Screener guide.
Your settings
Settings are kept for your Telegram chat and apply to every chart you request afterwards.
/indicator — your indicators for every chart.
/indicator macd(12,26,9), rsi(14), trix(15)
/indicator default           ==> back to the default indicators
/indicator                   ==> shows your list, with buttons for ready-made sets
The ready-made sets are:
- trend:
ema(20), ema(50), sma(200), bb(20,2), adx(14), macd(12,26,9) - momentum:
sma(20), sma(50), rsi(14), stoch(14,3,3), macd(12,26,9) - flows:
sma(20), sma(50), foreign, accum, bidoff
/theme — /theme dark or /theme light.
/bars — how many bars a chart shows: /bars 120, from 20 to 560.
Telegram suggests the commands as you type /, so /ind followed by a tap is enough.
Your own formulas on the chart: tql() and signal()
Any value the screener can compute can be drawn on a chart. Formulas are written in the screener language described in Writing Screener Criteria, including its shorthand names (xu, stok, vol, …) and crosses (cross_up, cross_down).
tql(formula[,style][;formula[,style]]...[;where])
signal(condition[,style][;condition[,style]]...[;where])tql()draws the value of each formula: as a line (line, the default) or a histogram (hist). The formulas of onetql()share a panel.signal()draws an arrow on each bar where the condition becomes true:up(the default) under the bar’s low,downabove its high. Addallto mark every bar where the condition holds, not only the first.
A formula reads the chart’s own bars unless it names a timeframe: on a weekly chart, sma(5) is the average of 5 weeks. A formula that names another timeframe, or another stock, reads it as it was at each bar of the chart, never anything after it:
/bbca d tql(weekly dto_stochk(14,14,3,3); weekly dto_stochd(14,14,3,3))
/bbca w tql(sma(5); daily sma(5); over)
/bbca tql(close / code:bbri close)
On a daily chart, a weekly value on a Wednesday is the week so far — Monday to Wednesday — just as the screener and the alerts saw it that day. So a signal() arrow appears on the same bar an alert would have fired.
Formulas are separated by ;. The last item says where they go:
| Where | tql() | signal() |
|---|---|---|
panel | in a panel of its own (the default) | — |
over | over the price | over the price (the default) |
overvol or ovol | over the volume | over the volume |
p1 … p4 | — | on the first to fourth indicator panel |
Several formulas in one panel
/bbca tql(ema(12); ema(26); ema(12) - ema(26), hist)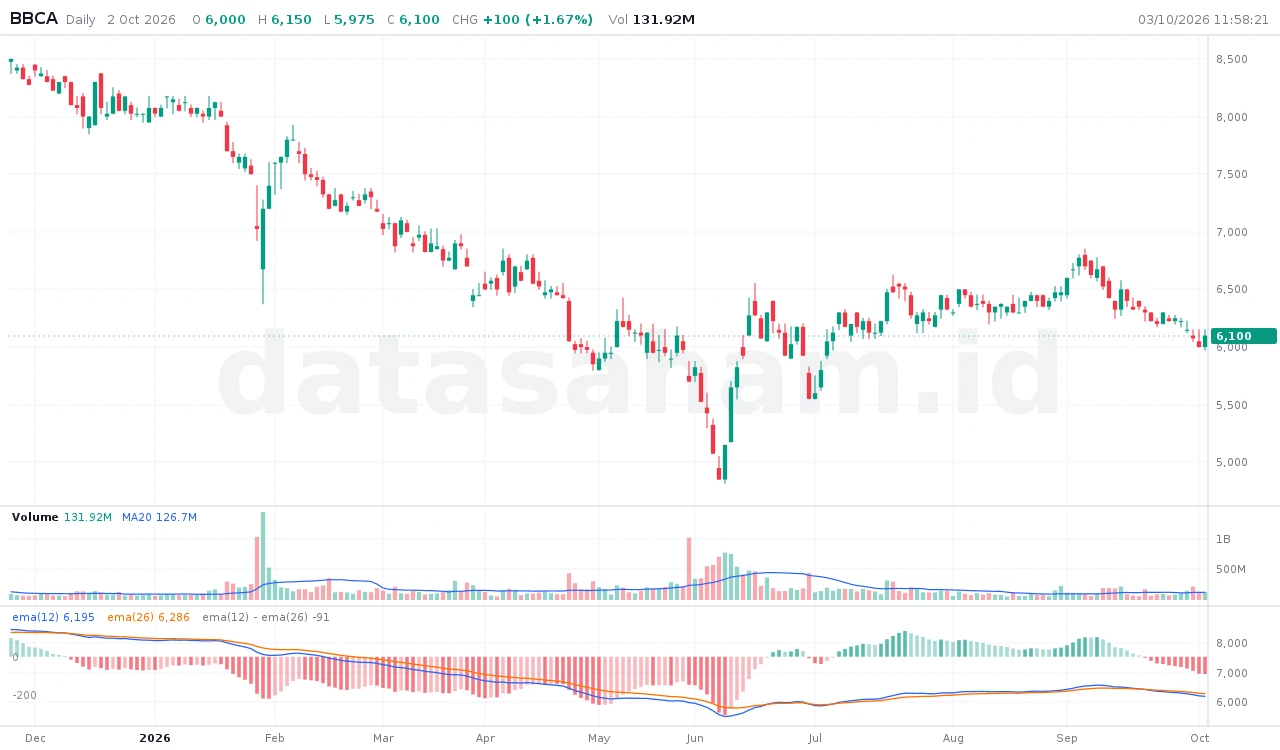
When the values in one panel differ greatly in size — here EMAs around 6,000 and their difference around ±200 — each gets its own scale. The first uses the axis on the right; the second is labelled inside the panel’s left edge, a third inside the right edge, up to four scales in a panel.
Lines over the price, with buy and sell arrows
/bbca tql(ema(12), line:blue; ema(26), line:orange; over) signal(ema(12) xu ema(26), up; ema(12) xd ema(26), down)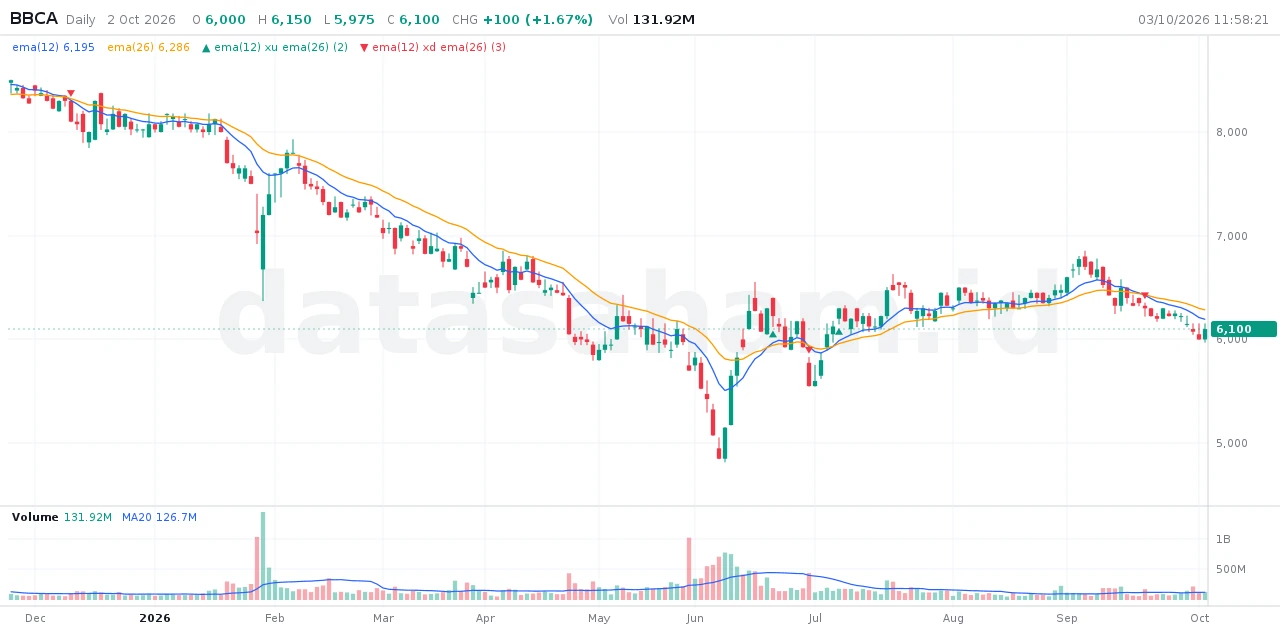
The legend of each signal shows how many times it occurred on the bars shown.
Several signals on one bar
When more than one condition is true on the same bar, their arrows stack rather than hide each other. The condition written first is nearest the bar. Each next arrow starts halfway along the one before, so every arrow’s point stays visible. The taller the stack, the more of your conditions agree on that bar.
/bbca ema(20) signal(close xu ema(20), up; rsi(14) xu 50, up; macdh xu 0, up; close xd ema(20), down; rsi(14) xd 50, down; macdh xd 0, down)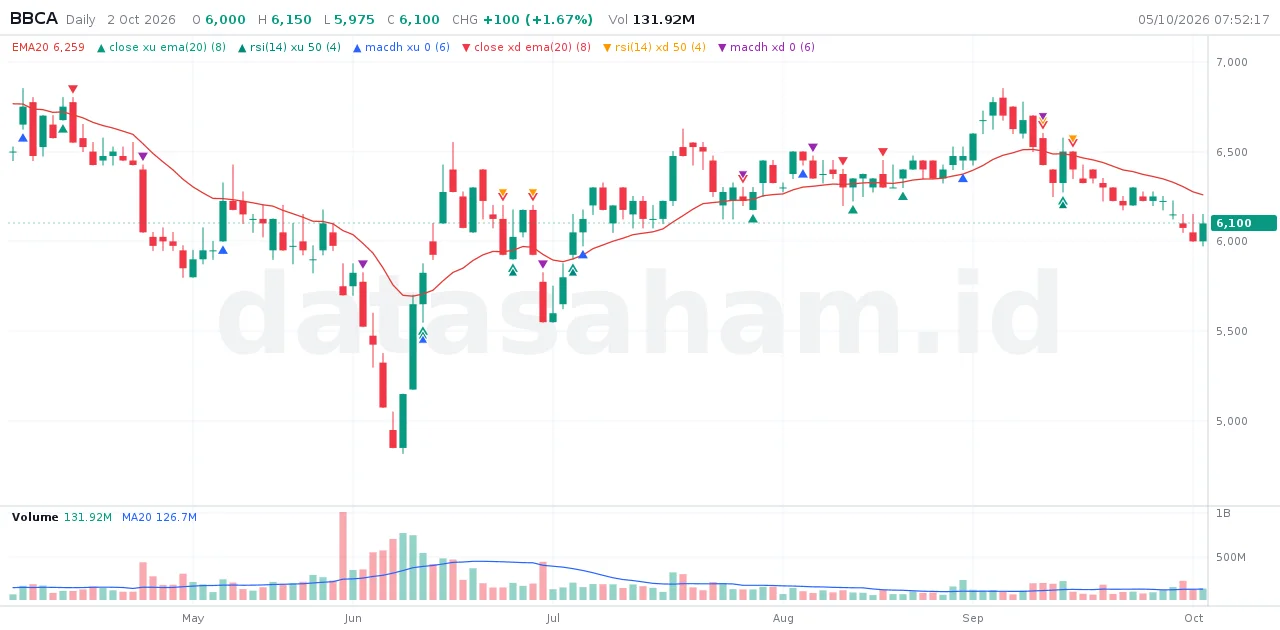
On an indicator panel and over the volume, the stack grows inward from the panel’s edge.
Signals on an indicator panel
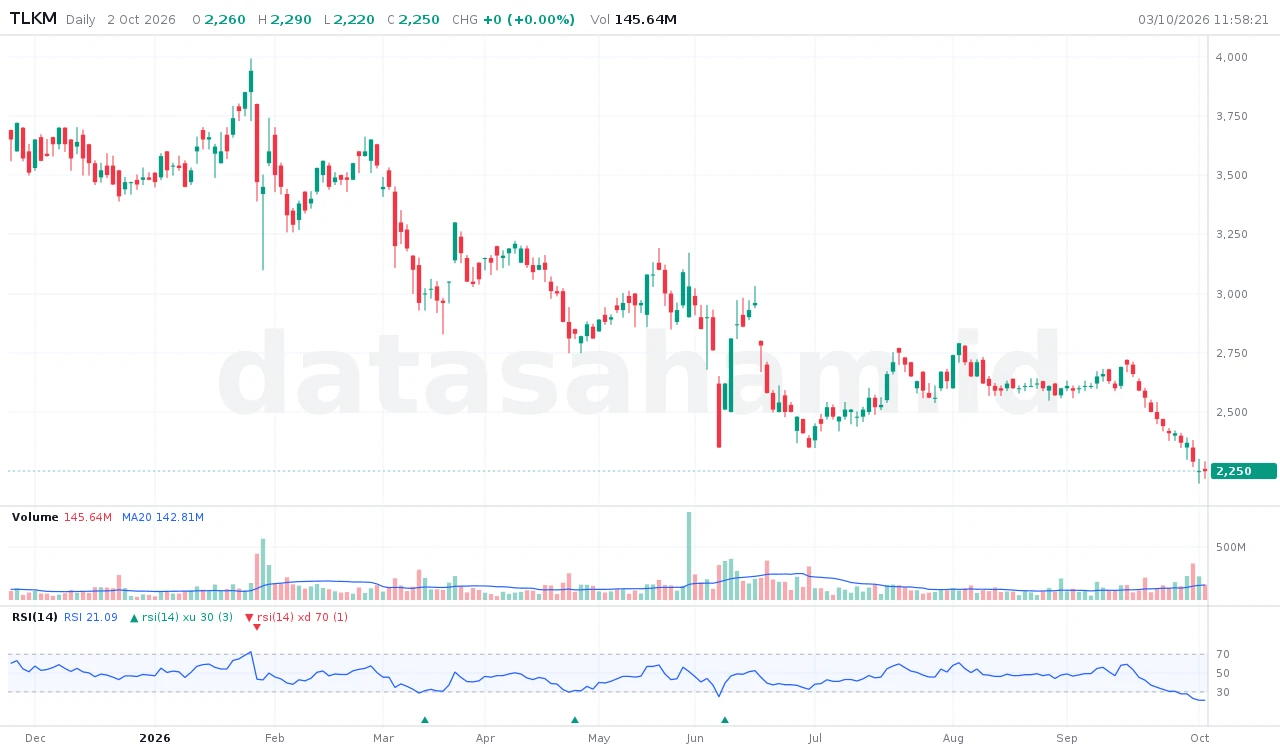
/tlkm rsi(14) signal(rsi(14) xu 30, up; rsi(14) xd 70, down; p1)p1 is the first indicator panel in the order written — here RSI. Arrows on a panel sit along its lower edge (up) and upper edge (down).
Over the volume
/bbri sma(20) tql(sma(vol, 20); ovol) signal(vol > 2 * sma(vol, 20), up; ovol)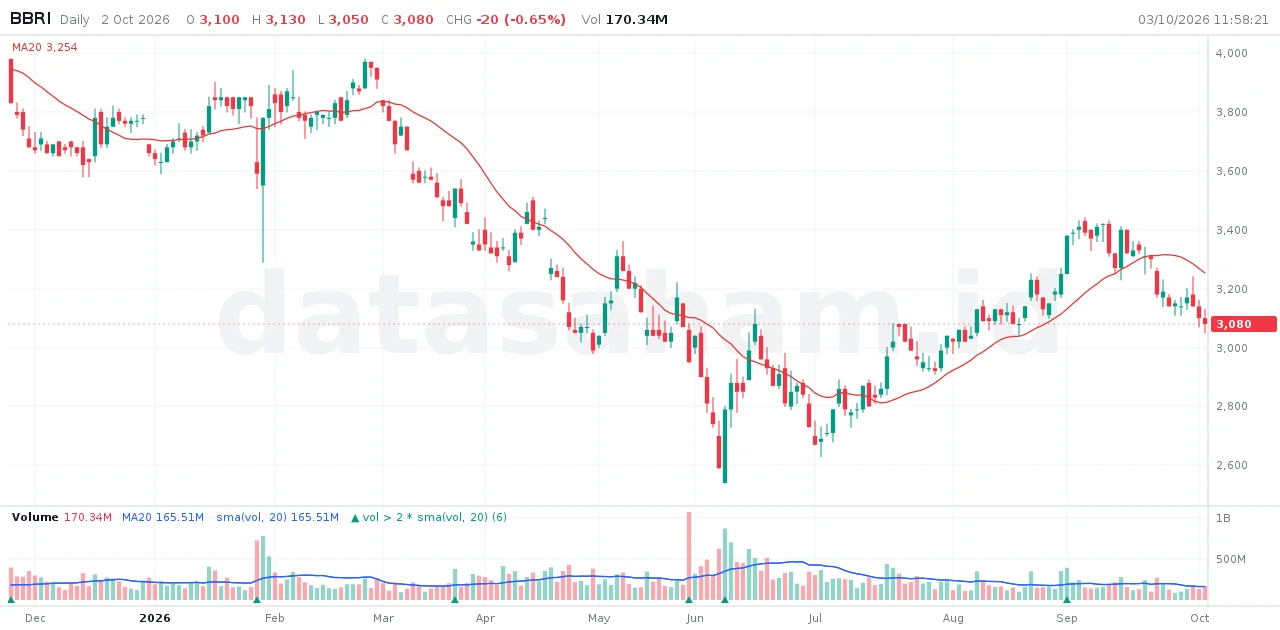
Colours
A style can be followed by a colour: line:blue, up:gold, down:navy. A histogram takes two — above and below zero — as in hist:green:red.
/asii tql(macdh, hist:teal:maroon) stoch(14,3,3) signal(stok xu stod, up:blue; stok xd stod, down:orange; p2)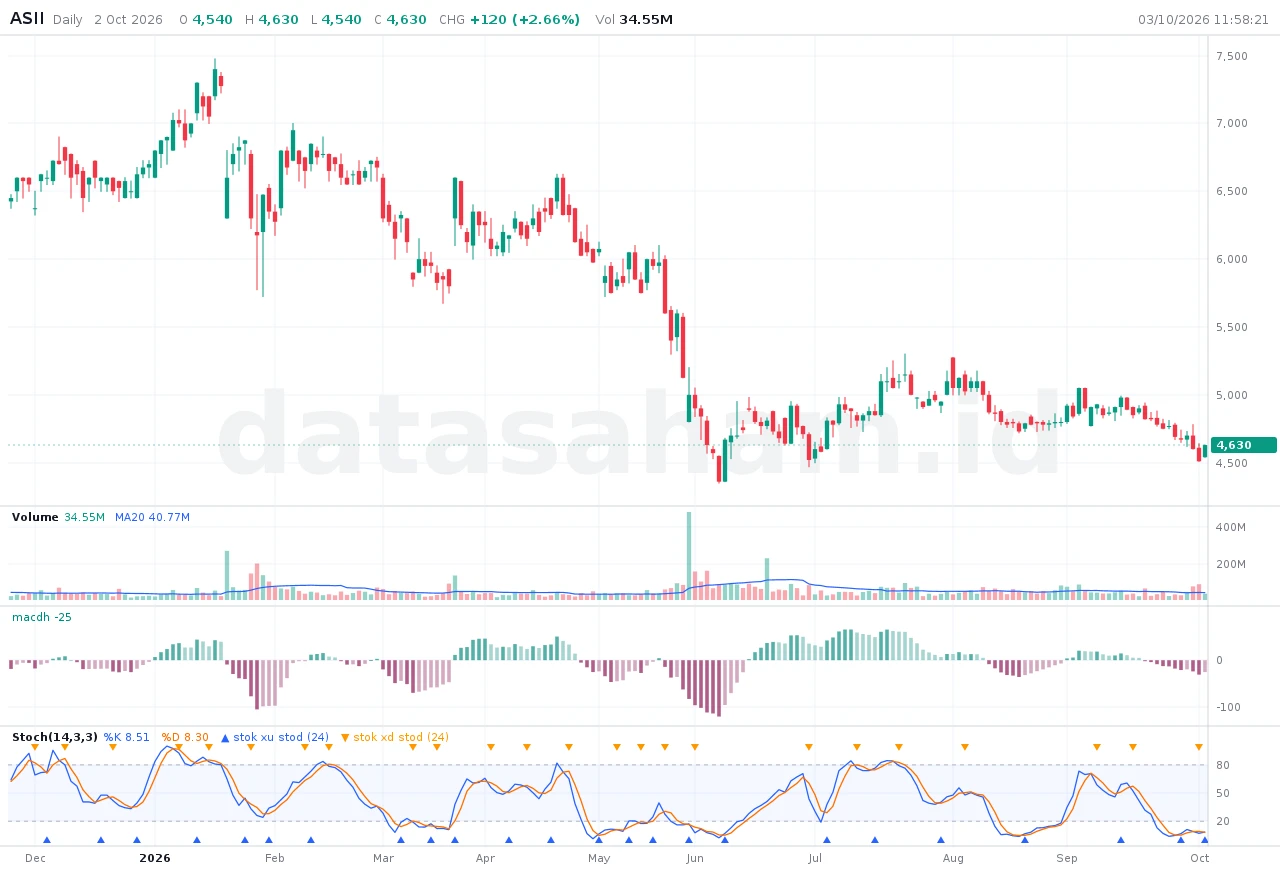
The colours are green, red, blue, orange, purple, teal, cyan, yellow, gold, pink, brown, lime, navy, maroon, gray, black, white, or any #rrggbb. Without one, up arrows take green, teal and blue in turn, and down arrows red, orange and purple.
Names for formulas: define, var and def()
The define and var of the screener language work in charts too. Inside a tql() or signal(), an item that starts with define or var is not drawn: it names a formula, and the formulas after it in the same brackets can use the name.
/bbca tql(define body close - open; sma(body, 5); sma(body, 20))For names that every tql() and signal() of the chart can use, put them in def(...):
/bbca def(define fast ema(12); define slow ema(26)) tql(fast, line:blue; slow, line:orange; over) signal(fast cross_up slow, up; fast cross_down slow, down) tql(define gap fast - slow; gap, hist:green:red; sma(gap, 9), line:blue)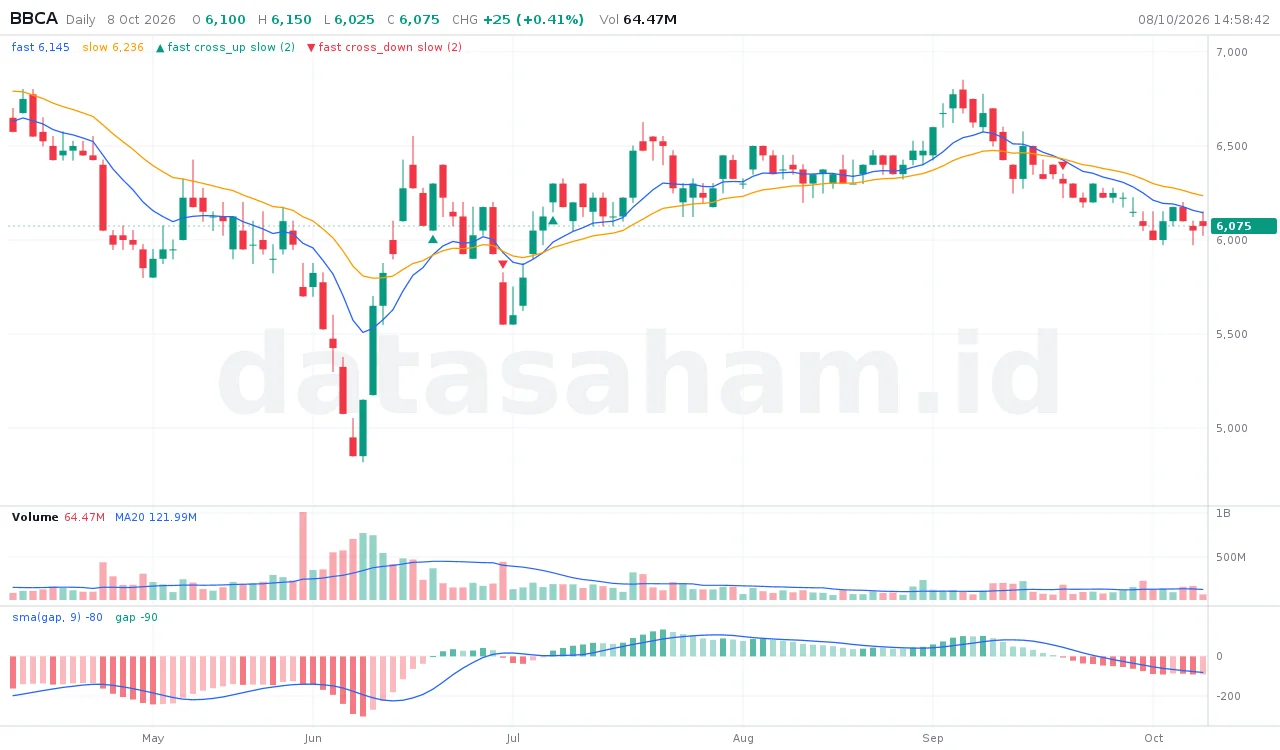
- In charts,
;separates the items, so a define ends at the;after it. - A define or var must come before the formulas that use it, and takes no style or colour.
- The legend shows the formula as you wrote it with the names:
fast,sma(gap, 9). - A name that will be read on earlier bars, as in
sma(gap, 9)or a cross, must be a define, as in the screener.
Limits
- Up to 8 formulas per chart, across all its
tql()andsignal(); defines and vars do not count. - A histogram cannot go over the price; put it in a panel or over the volume.
- All of a chart’s formulas together must finish within a few seconds. If a chart takes too long, zoom in to fewer bars or simplify the formulas.
tql(),signal()anddef()can be saved with/indicatorlike any indicator, up to 2,000 characters.
If something is not right, the bot replies with what it could not read and how it is written — the same messages as the screener.