Bandarmology comes from the Indonesian word bandar — a market operator or big player — with the suffix “-mology” meaning study or knowledge. The term is common in Indonesian stock market discussion, and refers to analysis that tries to identify which way the big players are trading a given stock, in order to follow their direction.
For traders who know the market reasonably well, today’s share price is not always set by genuine supply and demand. There are parties able to steer a price at a given moment. With enough money and enough lots, a bandar can move both sides of the book directly and artificially. They are also typically close to the company’s owners or majority shareholders — often part of the same group — so they can influence management decisions, or at minimum have accurate knowledge of internal conditions.
This is why a company posting losses, or with weak fundamentals, or already far above fair valuation, can still see its share price climb. And the reverse: a company with no fundamental problems can be driven sharply down, leaving analysts guessing at the cause. Usually the price moves first, and only afterwards do people go looking for the reason.
We do not know who these players are, but we know they exist. Throughout this article we use the term bandar without needing to know who is behind it.
Why bandarmology is possible on the IDX
On the Indonesian market, the identity of transacting parties is visible up to a point:
- the broker or securities firm used by buyer and seller
- the nationality of the party — local or foreign
This data appears on every executed transaction in the running trade and is accessible in any online trading application. We cannot see down to the individual account, because the exchange does not publish that. But the broker and local/foreign data alone is enough to build a picture of what the bandar is doing: accumulating, distributing, or nothing at all.
That last state usually shows up as small transaction volume and a price drifting slowly down as retail traders exit or cut losses, with other retail traders absorbing the supply.
The Data Saham Indonesia app provides two bandarmology analyses:
- Top 5 broker net transaction
- Foreign net transaction (NBSA: Net Buy Sell Asing)
Top 5 broker net transaction
Because we can see which broker each buyer and seller used, we can build a broker summary: how much each broker transacted on a stock, on both the buy and sell side, sorted from largest value to smallest.
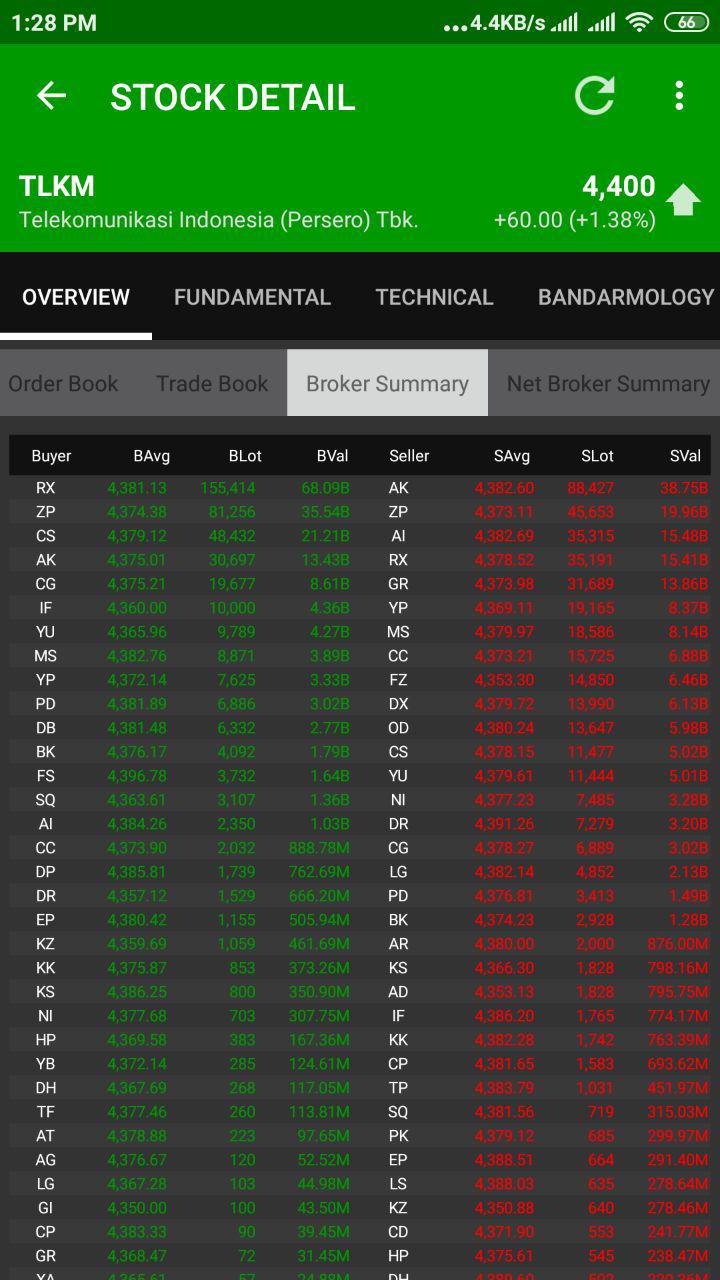
The table above shows which brokers had the largest buy and sell transactions in TLKM. A single broker can appear on both sides, because a broker represents many individual traders and investors as well as funds.
In this example broker ZP bought 81,256 lots of TLKM at an average price of Rp 4,374.38, and sold 45,653 lots at an average of Rp 4,373.11 — a net buy of 35,603 lots.
From this we can build a second table showing each broker’s net position.
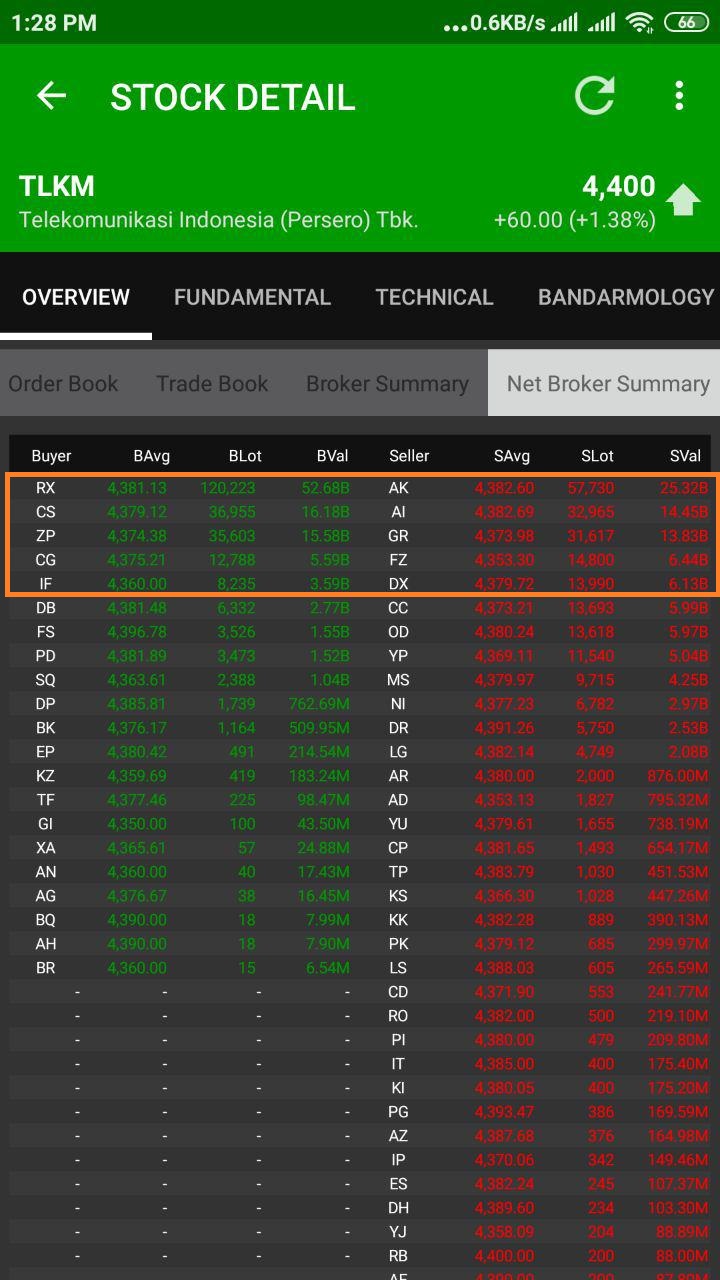
This table shows net transaction values per broker: buys minus sells. A positive figure is a net buy; a negative figure is a net sell.
Even at a glance, accumulation is visible in TLKM here: there are fewer buyers than sellers, which means buyers are gathering stock from many sellers.
The calculation
For the top 5 broker accumulation-distribution figure, we look only at the five largest buying brokers and the five largest selling brokers. The method compares the total of the top 5 buyers against the total of the top 5 sellers and takes the difference:
- If the BUY total is larger, the difference is recorded as accumulation.
- If the SELL total is larger, the difference is recorded as distribution.
top 5 broker = [total buy by top 5 buyers] - [total sell by top 5 sellers]

= [net of RX + CS + ZP + CG + IF] - [net of AK + AI + GR + FZ + DX]
= [213,804] - [151,102]
= 62,702
That is accumulation of 62,702 lots of TLKM by top 5 broker net transaction.
Why five brokers? Because a bandar generally works through several intermediaries, and those brokers can change from day to day. Here we assume five; in practice the number varies by stock and by operator.
In the app this is calculated in real time and displayed as a chart on the bandarmology screen, available on the daily timeframe as well as intraday — hourly, 15min and 5min — for faster trading.
Foreign net transaction (NBSA)
Foreign Flow, or NBSA (Net Buy Sell Asing), applies the same accumulation-distribution idea to transactions executed specifically by traders flagged as type F (Foreign).
Foreign accumulation-distribution = [total bought by foreign] - [total sold by foreign]NBSA is better suited to stocks that attract foreign interest, which are usually also the favourites in mutual fund portfolios. The data is available on the bandarmology screen across daily, hourly, 15min and 5min timeframes.
How a bandar operates
Disclaimer. We do not know any market operators personally and have never discussed their methods with one directly. What follows is a model built from observation and trading experience. To be safe, treat it as fiction.
There are two types — call them the benign operator and the predatory one.
The benign operator is really just an order intermediary. The job begins when they receive a buy or sell order from a large backer or an institutional fund manager, at a negotiated price and deadline. They then work the order, trying to buy below the instructed price on a buy mandate, and sell above it on a sell mandate. The spread between their average execution price and the instructed price is their profit — so they will work hard to push the price toward the level they want. Given a buy mandate, they may first drive the price down by selling their own inventory, then accumulate lower.
The accumulation-distribution cycle generally has several phases:
- Accumulation
- Mark-up
- Distribution
- Mark-down
- Exit
The cycle is illustrated well by Wyckoff Market Analysis on StockCharts ChartSchool. Bear in mind that is a simplified model; real charts are more complex, because accumulation and distribution can happen repeatedly and by different parties, sometimes working with each other and sometimes against.
Accumulation
In the early phase, an operator with better information about a stock or the market begins gathering stock. They do not want the price jumping as they collect, so accumulation is done quietly and in small pieces to avoid a visible surge in demand.
At the same time they work to keep supply high — leaning on negative market sentiment, or seeding negative analysis and news. With large capital behind them, an operator is close to brokers and to company management, which makes it quite possible to influence research or forecasts on a stock.
Accumulation does not have to come from the secondary market either; it can come through repo. From the shareholder’s side, repo means borrowing money against shares as collateral. From the operator’s side it is the reverse: borrowing shares against cash, to be returned later in shares.
Mark-up
The accumulation phase ends with mark-up: raising the price quickly to draw others in, tempted by the sharp movement. At this point rumours begin circulating among the operator’s inner circle that stock X is “having a party”. As the price moves, the rumour spreads wider.
Distribution
The price moves broadly sideways, transaction volume stays large, and there are several deep corrections that nonetheless keep returning to the highs. What is actually happening is that the operator is unloading stock to take profit, while still supporting the price above certain psychological levels so buying interest does not disappear.
News starts to come out, drawing in the people who missed the mark-up. This is the origin of buy on rumour, sell on news — by the time the news arrives, the party is nearly over.
Mark-down
By the end of distribution the operator holds only a small remainder. In a stock they dominate with no comparable counterparty, they can drive the price down by flooding the market. Under supply and demand, excess supply with no demand sends the price lower. The falling price panics traders, some cut their losses, and the price falls further.
Mark-down exists so the operator can accumulate cheaply again in the next cycle — particularly if the stock was borrowed and must be returned in shares.
Exit
Where the operator does not need to accumulate again at lower levels, they simply leave. Price action turns listless, volume is thin, and the price grinds lower as trading is dominated by trapped investors cutting losses. This is what has happened to many stocks now parked at Rp 50 — and once a stock reaches that floor, exiting becomes very difficult.
It is entirely possible that after five or ten years the old operator, or a new one, returns and revives trading, starting the cycle again. Usually accompanied by rumours of an acquisition, a corporate action, or a new line of business.
Avoiding losses in manipulated stocks
First, do not trade stocks where the operator has no counterparty — meaning the stock is controlled by a single player. Your energy is better spent analysing stocks that actually have a valuation. In stocks like these even bandarmology data is of limited help, because the operator can easily manipulate the numbers; they know how the calculation works too.
There are two exceptions:
- You personally know someone close to the operator and get information directly — which means you are monetising that relationship.
- You genuinely want to gamble and are comfortable losing 100% of what you put in, with an amount that is trivial relative to your total wealth.
There is nothing wrong with gambling, particularly given that the stock market is one of the few legal venues for it in Indonesia. What can go wrong is gambling without realising you are gambling — that is the dangerous part.