The buy and sell signals in the app are derived from technical analysis data. This document describes the rules used to translate that data into buy and sell signals.
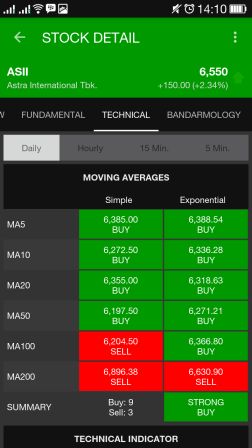
Each indicator is evaluated separately, and the results are summarised into a single signal per stock per timeframe. The thresholds below are the rules the app actually applies — not generic rules shared across every platform.
Moving Average (MA)
A moving average smooths price action over a set number of periods, making the direction of a trend easier to read and potential support and resistance levels easier to estimate. The two most common types are the SMA, a plain average of price over N periods, and the EMA, which weights recent prices more heavily and therefore reacts faster to change.
Signal rules:
- Buy — the current moving average value is greater than the previous one (the curve turns upward).
- Sell — the current moving average value is less than the previous one (the curve turns downward).
- Neutral — the current value equals the previous value.
Relative Strength Index (RSI)
RSI is a momentum oscillator comparing the magnitude of recent gains against the magnitude of recent losses over a set period. It ranges between 0 and 100.
Overbought > 70 > BUY > 52 > Neutral > 48 > SELL > 30 > OversoldAn overbought or oversold reading is not itself a buy or sell signal: momentum oscillators can reach those levels and stay there while a strong up or down trend continues. Treat them as an alert to be ready for a turning point — price may be overbought or oversold and still not have turned.
Stochastic
The Stochastic Oscillator shows where the closing price sits relative to the high-low range over a set number of periods.
Overbought > 80 > BUY > 52 > Neutral > 48 > SELL > 20 > OversoldThe note on overbought and oversold readings above applies equally here.
StochRSI
StochRSI applies the Stochastic formula to RSI values rather than to price, making it an indicator of an indicator. The result measures where RSI sits relative to its own high-low range.
Overbought > 80 > BUY > 52 > Neutral > 48 > SELL > 20 > OversoldMACD
MACD turns two trend-following moving averages into a momentum oscillator by subtracting the longer-period average from the shorter-period one. It fluctuates above and below the zero line as the two averages converge, cross, and diverge — combining trend-following behaviour with a momentum reading.
BUY > 2 > Neutral > -2 > SELLATR
Average True Range measures volatility, not direction. It therefore produces no buy or sell signal — only a volatility reading.
Current ATR - SMA5(ATR) = DIFF : High Volatile > 2 > Neutral > -2 > Less VolatileADX
The Average Directional Index measures the strength of a trend without regard to its direction. Direction comes from two companion indicators, the Plus Directional Indicator (+DI) and Minus Directional Indicator (−DI). Broadly, bulls have the advantage when +DI exceeds −DI, and bears when −DI exceeds +DI. Crossovers between the two directional indicators, combined with ADX, form a complete system.
1: STRONG TREND > 25 > WEAK TREND
2: +DI - -DI = DIFF : BUY > 0 > SELL
CCI
The Commodity Channel Index measures the current price level relative to its average over a set period. High positive values mean price is well above its average, indicating buying strength; low negative values indicate the opposite.
Overbought > 100 > BUY > 50 > Neutral > -50 > SELL > -100 > OversoldUO
The Ultimate Oscillator combines buying pressure across three different period lengths. It rises as buying pressure strengthens and falls as it weakens.
Overbought > 70 > BUY > 52 > Neutral > 48 > SELL > 30 > OversoldROC
Rate-of-Change is a pure momentum oscillator measuring the percentage change between the current price and the price N periods ago.
Overbought > 10 > BUY > 0 > Neutral > 0 > SELL > -10 > OversoldWilliams %R
Williams %R reflects the closing price relative to the highest high over a defined look-back period — essentially the inverse of the Fast Stochastic Oscillator. It oscillates between 0 and −100.
Overbought > -20 > BUY > -48 > Neutral > -52 > SELL > -80 > OversoldDisclaimer
All information on this page should be independently verified and confirmed. By using it, you agree that your use of the app and of all information and services within it is entirely at your own risk and responsibility.